Process data are becoming more and more popular in education research. In the field of computer-based assessments of collaborative problem solving (ColPS), process data have been used to identify students’ test-taking strategies while working on the assessment, and such data can be used to complement data collected on accuracy and overall performance. Such information can be used to understand, for example, whether students are able to use a range of styles and strategies to solve different problems, given evidence that such cognitive flexibility may be important in labor markets and societies. In addition, process information might help researchers better identify the determinants of poor performance and interventions that can help students succeed. However, this line of research, particularly research that uses these data to profile students, is still in its infancy and has mostly been centered on small- to medium-scale collaboration settings between people (i.e., the human-to-human approach). There are only a few studies involving large-scale assessments of ColPS between a respondent and computer agents (i.e., the human-to-agent approach), where problem spaces are more standardized and fewer biases and confounds exist. In this study, we investigated students’ ColPS behavioral patterns using latent profile analyses (LPA) based on two types of process data (i.e., response times and the number of actions) collected from the Program for International Student Assessment (PISA) 2015 ColPS assessment, a large-scale international assessment of the human-to-agent approach. Analyses were conducted on test-takers who: (a) were administered the assessment in English and (b) were assigned the Xandar unit at the beginning of the test. The total sample size was N = 2,520. Analyses revealed two profiles (i.e., Profile 1 [95%] vs. Profile 2 [5%]) showing different behavioral characteristics across the four parts of the assessment unit. Significant differences were also found in overall performance between the profiles.
Collaborative problem-solving (ColPS) skills are considered crucial 21st century skills (Graesser et al., 2018; Greiff & Borgonovi, 2022). They are a combination of cognitive and social skill sets (Organization for Economic Co-operation and Development [OECD], 2017a), involving “an anchoring skill—a skill upon which other skills are built” (Popov et al., 2019, p. 100). Thus, it makes sense that the importance of ColPS has been continually emphasized in research and policy spheres. Modern workplaces and societies require individuals to be able to work in teams to solve ill-structured problems, so having a sufficient level of the skills and the ability to effectively execute them are expected and required in many contexts in people’s lives (Gottschling et al., 2022; Rosen & Tager, 2013, as cited in Herborn et al., 2017; Sun et al., 2022). Consequently, interest in research and policies on ColPS has grown in the past few years.
In 2015, the Program for International Student Assessment (PISA), managed by the OECD, administered an additional, computer-based assessment of ColPS alongside the core assessment domains of mathematics, reading, and science. The PISA 2015 ColPS assessment was administered in 52 education systems, targeting 15-year-old students (OECD, 2017a, 2017b). It has provided a substantial body of theory and evidence related to computer-based assessments of the skills involved in the human-to-agent approach (i.e., H-A approach), which makes test-takers collaborate with a couple of computer agents to tackle simulative problems. A great deal of subsequent theoretical and empirical studies on ColPS have followed, drawing on the established framework of the PISA 2015 ColPS assessment and the data that were generated (e.g., Chang et al., 2017; Child & Shaw, 2019; Graesser et al., 2018; Herborn et al., 2017; Kang et al., 2019; Rojas et al., 2021; Swiecki et al., 2020; Tang et al., 2021; Wu et al., 2022).
Despite a growing body of research on ColPS, an unexplained aspect of ColPS revolves around the question, “What particular [ColPS] behaviors give rise to successful problem-solving outcomes?” (Sun et al., 2022, p. 1). To address this question, a few studies have used students’ process data (e.g., response times) and specifically attempted to profile these students on the basis of their data to investigate behavioral patterns that go beyond performance. Indeed, analyzing test-takers’ process data makes it possible to understand the characteristics of performance in depth, for instance, how 15-year-old students interacted in problem spaces, such as incorrect responses despite overall effective strategies or correct responses that relied on guessing (He et al., 2022; Teig et al., 2020). However, such studies are still in the embryonic stage and have mostly revolved around the relatively small- to medium-scale assessments with the human-to-human approach (i.e., H-H approach), which entails naturalistic collaboration with people (e.g., Andrews-Todd et al., 2018; Dowell et al., 2018; Han & Wilson, 2022; Hao & Mislevy, 2019; Hu & Chen, 2022). Little research has been carried out on the process data from large-scale assessments that have used the H-A approach, such as the one employed in PISA 2015.
Therefore, in this research, we aimed to investigate test-takers’ profiles to address the aforementioned question about the behaviors that lead to successful collaborative problem solving. To do so, we conducted an exploratory latent profile analysis (LPA), a profiling methodology that is based on the two types of process data collected in PISA 2015: (a) response time (i.e., the sum of “the time spent on the last visit to an item” per part; OECD, 2019, p. 3) and (b) the number of actions (e.g., “posting a chat log” or “conducting a search on a map tool”; De Boeck & Scalise, 2019, p. 1). As described in the previous literature, PISA 2015 has several advantages, including automated scoring and easier and more valid comparisons in standardized settings, although it simultaneously has drawbacks (e.g., it is limited in its ability to deliver an authentic collaboration experience; Han et al., 2023; Siddiq & Scherer, 2017). It should be noted that PISA 2015 is just one of many (large-scale) H-A assessments on ColPS. Thus, there will be myriad possible ways to find behavioral patterns. As a steppingstone, we hope the results of this study will be helpful for clarifying the behaviors of (un)successful participants in ColPS and will thus be conducive to the development of appropriate interventions (Greiff et al., 2018; Hao & Mislevy, 2019; Hickendorff et al., 2018; Teig et al., 2020). Furthermore, as we identified subgroups on the basis of the process data, the subgroups will be used to design better task situations and assessment tools in terms of validity and statistical scoring rules in the future (AERA, APA, & NCME, 2014; Goldhammer et al., 2020, 2021; Herborn et al., 2017; Hubley & Zumbo, 2017; Li et al., 2017; Maddox, 2023; von Davier & Halpin, 2013).
Literature review
The ColPS assessment in PISA 2015 and the Xandar unit
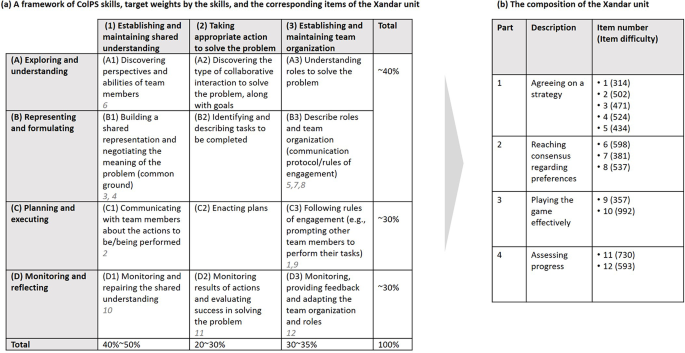
ColPS in PISA 2015 is defined as “the capacity of an individual to effectively engage in a process whereby two or more agents attempt to solve a problem by sharing the understanding and effort required to come to a solution and pooling their knowledge, skills and efforts to reach that solution” (OECD, 2017a, p. 6). To design and implement the assessment, the OECD defined a matrix of four individual problem-solving processes and three collaboration processes, for a total of 12 different skills (OECD, 2017a; see Fig. 1). The four individual problem-solving processes came from PISA 2012 and entail (a) Exploring and understanding, (b) Representing and formulating, (c) Planning and executing, and (d) Monitoring and reflecting, whereas the three collaborative competencies are (a) Establishing and maintaining shared understanding, (b) Taking appropriate action to solve the problem, and (c) Establishing and maintaining team organization.
Fig. 1
The overall composition of the Xandar unit and a general guideline of weighting. Note. The number in Figure 1(a), highlighted in grey and italics, indicates the item number of the Xandar unit corresponding to each subskill. The item difficulty values in Figure 1 (b) are reported on the PISA scale. The framework of Figure 1 is based on the OECD (2016, 2017b). Adapted from the PISA 2015 collaborative problem-solving framework, by the OECD, 2017 (https://www.oecd.org/pisa/pisaproducts/Draft%20PISA%202015%20Collaborative%20Problem%20Solving%20Framework%20.pdf). Copyright 2017 by the OECD. The data for the descriptions of the Xandar unit are from OECD (2016). Adapted from Description of the released unit from the 2015 PISA collaborative problem-solving assessment, collaborative problem-solving skills, and proficiency levels, by the OECD, 2016 (https://www.oecd.org/pisa/test/CPS-Xandar-scoring-guide.pdf). Copyright 2016 by the OECD
With the matrix of four problem-solving and three collaboration processes in mind, the assessment was designed and consisted of assorted items, that is, a single communicative turn between the test-taker and agent(s), actions, products, or responses during ColPS (OECD, 2016). With difficulty ranging from 314 to 992, each item measured one (or sometimes more than one) of the 12 skills, and a score of 0, 1, or 2 was assigned (Li et al., 2021; OECD, 2016, 2017a). Diverse sets of items referred to each task (e.g., consensus building), and each task covered one component of each (problem scenario) unit with a predefined between-unit dimension (e.g., school context vs. non-school context) and various within-unit dimensions (e.g., types of tasks, including jigsaw or negotiation; see details in OECD, 2017a).
In the computer-based assessment mode of PISA 2015Footnote 1, each test-taker worked on four 30-min clusters (i.e., 2 h in total), two of which were in the domain of science, whereas the rest involved reading, mathematics, or ColPS (OECD, 2017a; see Fig. 2). Thus, one test-taker could have had one or two ColPS units—with different positions depending on an assessment form—if their countries or economies were participating in the ColPS assessment (see OECD, 2017c). Among the ColPS units in the main PISA 2015 study, only one unit was released in the official OECD reports, called Xandar, with additional contextual information included to help interpret the findings (e.g., the unit structure or item difficulty) beyond the raw data, which included actions, response times, and performance levels (e.g., OECD, 2016). Consequently, this unit was utilized in the current study because the valid interpretations of the behavioral patterns we identified relied on each item’s specific contextual information (Goldhammer et al., 2021).
Fig. 2
The computer-based assessment design of the PISA 2015 main study, including the domain of ColPS. Note. R01-R06 = Reading clusters; M01-M06 = Mathematics clusters; S = Science clusters; C01-C03 = ColPS clusters. From PISA 2015 Technical Report (p. 39), by the OECD, 2017 (https://www.oecd.org/pisa/data/2015-technical-report/PISA2015_TechRep_Final.pdf). Copyright 2017 by the OECD
In the Xandar unit, each test-taker worked with two computer agents to solve problems on the geography, people, and economy of an imaginary country named Xandar (OECD, 2017b; see Fig. 3). It should be noted that performance in the Xandar unit was assessed as correct actions or responses in the ColPS process, not as the quality of group output. According to the OECD, this unit is “in-school, private, non-technology” context-based and is composed of four separate parts of “decision-making and coordination tasks” in the scenario of a contest (OECD, 2017b; p. 53). The detailed composition of the unit is described in Fig. 1(b).
Fig. 3
An example screenshot of the PISA 2015 Xandar unit. Note. Adapted from Description of the released unit from the 2015 PISA collaborative problem-solving assessment, collaborative problem-solving skills, and proficiency levels (p. 11), by the OECD, 2016 (https://www.oecd.org/pisa/test/CPS-Xandar-scoring-guide.pdf). Copyright 2016 by the OECD
As Fig. 1 shows, the unit did not cover all 12 skills from the competency framework but covered the skills only partially across the four parts of the assessment. More information about each part is as follows.
1.
In Part 1 (i.e., the stage for agreeing on a strategy as a team), participants get accustomed to the assessment unit, including the chat interface and task space (De Boeck & Scalise, 2019; OECD, 2017b). The stage aims to establish common strategies for ColPS under the contest rules (De Boeck & Scalise, 2019). Part 1 contains five items, whose item difficulty ranges from 314 to 524 (OECD, 2016).
2.
In Part 2 (i.e., reaching a consensus regarding preferences), participants and the computer agents each allocate a topic to themselves (i.e., the geography, people, or economy of Xandar; OECD, 2017b). In this process, they should reach a consensus by resolving disagreements within their team (OECD, 2017b). The purpose of this stage is to establish a mutual understanding (De Boeck & Scalise, 2019). There are three items in Part 2, with a difficulty of 381, 537, and 598, respectively (OECD, 2016).
3.
In Part 3 (i.e., playing the game effectively), participants respond to the questions about the geography of Xandar (OECD, 2017b), regardless of their choice in Part 2. In this part, they proceed with the contest and should respond appropriately to the agents who violate common rules and raise issues (De Boeck & Scalise, 2019). Part 3 consists of two items (i.e., one with a difficulty of 357 and the other with a difficulty of 992; OECD, 2016).
4.
In Part 4 (i.e., assessing progress), participants are required to monitor and assess their team’s progress (OECD, 2017b). In this part, the computer agents pose challenges to the progress evaluation and ask for extra help for the team to solve problems on the economy of Xandar (De Boeck & Scalise, 2019). Part 4 is composed of two items (i.e., one with a difficulty of 593 and the other with a difficulty of 730; OECD, 2016).
Process data and profiling students on the basis of response times and actions
Process data refer to “empirical information about the cognitive (as well as meta-cognitive, motivational, and affective) states and related behavior that mediate the effect of the measured construct(s) on the task product (i.e., item score)” (Goldhammer & Zehner, 2017, p. 128). These data can thus indicate “traces of processes” (e.g., strategy use or engagement; Ercikan et al., 2020, p. 181; Goldhammer et al., 2021; Zhu et al., 2016). Such information is recorded and collected via external instruments and encompasses diverse types of data, such as eye-tracking data, paradata (e.g., mouse clicks) or anthropological data (e.g., gestures; Hubley & Zumbo, 2017). Process data have recently been spotlighted, as technology-based assessments have advanced with the growth of data science and computational psychometrics, thereby increasing the opportunities for their exploitation across the entire assessment cycle (Goldhammer & Zehner, 2017; Maddox, 2023).
A substantial number of studies on response times and the number of clicks (i.e., defined as actions in this study) along with test scores have been published, specifically in the field of cognitive ability testing (e.g., studies on complex problem-solving). For instance, according to Goldhammer et al. (2014), response times and task correctness have a positive relationship when controlled reasoning-related constructs (e.g., computer-based problem-solving) are being measured, in contrast to repetitive and automatic reasoning (e.g., basic reading; Greiff et al., 2018; Scherer et al., 2015). Greiff et al. (2018) also argued that the number of interventions employed across the investigation stages can be used as a way to gauge the thoroughness of task exploration because they indicate in-depth and longer commitments to the complex problem-solving task.
In the sphere of ColPS assessments—related to and not mutually exclusive from the domain of complex problem-solving—there is also currently active research on these data, particularly in the contexts of assessments that employ the H-H approach. One such research topic involves profiling students on the basis of their data to examine the behavioral patterns that occur during ColPS. For instance, Hao and Mislevy (2019) found four clusters via a hierarchical clustering analysis of communication data. One of their results was that participants’ performance level tended to improve (i.e., the scores on the questions about the factors related to volcanic eruption) through more negotiations after the team relayed information. Andrews-Todd et al. (2017) also discovered four profiles through the analysis of chat logs from applying Andersen/Rasch multivariate item response modeling: cooperative, collaborative, fake collaboration, and dominant/dominant interaction patterns. They reported that the propensities for displaying the cooperative and collaborative interaction patterns were positively correlated with the performance outcomes (r = .28 and 0.11, ps < 0.05), in contrast to the dominant/dominant interaction pattern, which was negatively correlated with performance outcomes (r = − .21, p < .01). However, there was no significant correlation between outcomes and the inclination to exhibit the fake collaboration pattern (r = − .02, p = .64). Such results cannot be directly applied to assessments that have applied the H-A approach due to the differences in interactions.
Compared with studies that have employed the H-H approach, there is still not much research that has attempted to identify behavioral patterns on the basis of the process data collected in ColPS assessments that have employed the H-A approach. One of the few studies is De Boeck and Scalise (2019). They applied structural equation modeling to data on United States students’ actions, response times, and performance in each part of the PISA 2015 Xandar unit. Consequently, they found a general correlation between the number of actions and response times, a finding that suggests that “an impulsive and fast trial-and-error style” was not the most successful strategy for this unit (p. 6). They also demonstrated specific associations for each part of the unit. For example, performance was related to more actions and more time in Part 4 (i.e., the last part about assessing progress), in contrast to Part 1 on understanding the contest, where the association between actions and performance was negative (De Boeck & Scalise, 2019; OECD, 2016). Notably, these findings resonate with earlier studies in other settings employing different tools. For instance, despite being implemented in the H-H setting, Chung et al. (1999) reported that low-performing teams exchanged more predefined messages than high-performing teams during their knowledge mapping tasks. However, De Boeck and Scalise (2019) showed the general patterns of their entire sample of students and did not delve into the distinctiveness of the patterns, in contrast to the current study, which was designed to explore unobserved student groups and their behavioral characteristics via LPA. Furthermore, the patterns they identified in their study were associated with the performances in each part, thereby making it difficult to determine the relationship between the patterns and the overall level of performance. Their participants were also limited to only individuals from the United States. Therefore, there is still a need to uncover behavioral patterns on the basis of process data and their relationships with overall performance in detail, relying on more diverse populations in more standardized settings and by taking advantage of the H-A approach.
Research questions
The objective of this research was to investigate different behavioral profiles of test-takers by drawing on the two types of process data that are available (i.e., response time and the number of actions) collected during the PISA 2015 ColPS assessment, particularly in the four parts across the Xandar unit. To achieve the objective, we posed two research questions: (a) Which profiles can be identified on the basis of students’ response times and the number of actions in the Xandar unit? and (b) How do the profiles differ in terms of overall performance?
Methodology
Participants and sampling
The current study examined the PISA 2015 ColPS assessment participants, specifically those who (a) took the assessment in English and (b) had the Xandar unit as the first cluster because we wanted to control for potential sources of bias (i.e., languages, item position, and fatigue). Out of the total of 3,065 students belonging to 11 education systems (i.e., Australia, Canada, Hong Kong, Luxembourg, Macao, New Zealand, Singapore, Sweden, the United Arab Emirates, the United Kingdom, and the United States)Footnote 2, 539 outliers were excluded via the robust Mahalanobis distance estimation with a 0.01 cutoff for the p-value (see Leys et al., 2018) to avoid the influence of outliers on the profile solution (Spurk et al., 2020).Footnote 3 In addition, six inactive students were subsequently excluded (i.e., those who did not exhibit any activities across the indicators). Hence, the final sample consisted of 2,520 students (see Table 1). The student samples were chosen according to the specific two-stage sampling procedures employed by the OECD (De Boeck & Scalise, 2019; OECD, 2009) that bring about different probabilities of each student’s participation (Asparouhov, 2005; Burns et al., 2022; Scherer et al., 2017). Given the OECD’s official guidelines and the previous literature related to PISA and LPA (e.g., Burns et al., 2022; OECD, 2017c; Wilson & Urick, 2022), we included the sampling hierarchy and the sampling weights of the students in the analyses (see also the Statistical Analyses section).
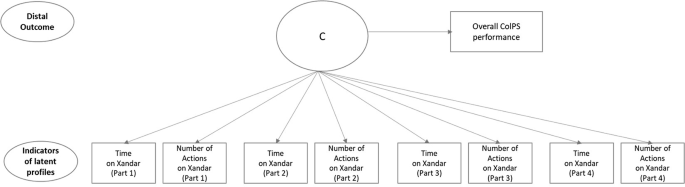
We employed a total of eight indicators for the analyses: (a) the total response time (i.e., one indicator per part for a total of four indicators; the sum of “the time spent on the last visit to an item” per part; OECD, 2019) and (b) the total number of actions (i.e., one indicator per part for a total of four indicators). For the distal outcome variables, we utilized the 10 plausible ColPS values (i.e., PV1CLPS-PV10CLPS), which have “a weighted mean of 500 and a weighted standard deviation of 100” (OECD, 2017c, p. 234). The plausible values are “multiple imputed proficiency values” given the test-takers’ patterns of responses, which thus include probabilistic components and indicate their possible level of ability (i.e., a latent construct; Khorramdel et al., 2020, p. 44). To analyze the plausible values, we referred to the recommendations made in the official guidelines of the OECD (e.g., OECD, 2017c) and the previous literature on large-scale assessments (e.g., Asparouhov & Muthén, 2010; Rutkowski et al., 2010; Scherer, 2020; Yamashita et al., 2020, see also Statistical Analyses section). All measures included in this study were open to the public and can be found in the PISA 2015 repository database (https://www.oecd.org/pisa/data/2015database/).
Data cleaning and preparation
We used R 4.2.1 to prepare the data (R Core Team, 2022). As shown above, we extracted the sample students on the basis of two conditions: (a) whether they took the assessment in English and (b) whether they had the Xandar unit as the first cluster of the assessment. We then used Mplus version 8.8 (Muthén & Muthén, 1998–2017) to conduct exploratory analyses for all indicators. Given that the variances between the response time indicators were too high, the analyses did not converge. Thus, we applied a logarithmic transformation to the response time indicators in order to reduce the variance in further steps. Note that the action indicators could not be transformed because one student had none (i.e., 0 actions) in Part 4.
Statistical analyses
LPA was used to identify latent profiles of students on the basis of response time and action data measured in the Xandar unit (Morin et al., 2011; see the model in Fig. 4). LPA, a more person-centered and model-based approach, has many advantages over other traditional clustering methods, such as k-means clustering (Magidson & Vermunt, 2002; Morin et al., 2011). In particular, it classifies individuals into clusters on the basis of the estimated probabilities of belonging to specific profiles, where other covariates, such as demographics, can also be considered (Magidson & Vermunt, 2002; Pastor et al., 2007; Spurk et al., 2020). It also specifies alternative models, thereby making it possible to compare multiple models on the basis of various fit statistics (Morin et al., 2011).
Fig. 4
Full LPA model in this research. Note. C denotes the categorical latent variable describing the latent profiles
Relying on these strengths of LPA, we conducted the statistical analyses with reference to syntax written by Burns et al. (2022) and Song (2021). We followed the default assumption of the traditional LPA that the residual correlations between the indicators can be explained only by profile membership (Morin et al., 2011; Vermunt & Magidson, 2002). There was insufficient empirical and theoretical evidence that it would be acceptable to relax assumptions related to the relationship between the two types of process data from the PISA 2015 ColPS assessment (Collie et al., 2020; Meyer & Morin, 2016; Morin et al., 2011). Therefore, we fixed (a) the covariances between the latent profile indicators to zero and (b) the variances to equality across profiles (i.e., default options; Asparouhov & Muthén, 2015; Muthén & Muthén, 1998–2017).
At the same time, because correlation coefficients greater than 0.50 were found between some indicators (see Table 2), we separately relaxed some assumptions (i.e., some indicators may be correlated within profiles) and tested them. According to Sinha et al. (2021), the cases with correlation coefficients over 0.50 may have an impact on modeling and fit statistics, so they should be examined carefully. Thus, we tried to formally check the level of local dependence between the indicators but could get only some evidence from the factor loadings due to the constraints of the statistical program. Using the evidence we gathered and drawing on Sinha et al. (2021), we separately conducted sensitivity analyses by relaxing the assumption (i.e., allowing local dependence between two specific indicators within profiles) or removing one of them. However, not all trials terminated well when based on the relaxed assumptions. When removing some indicators (e.g., C100Q01T and C100Q02A), the relative model fit statistics improved for some trials, but the overall profile membership did not change substantially. Therefore, we decided to stick with the current model with all the indicators and the most conservative assumptions.
In this study, we inspected several models with one to 10 latent profiles, particularly employing the standard three-step approach, in line with best practices (Asparouhov & Muthén, 2014; Bakk & Vermunt, 2016; Dziak et al., 2016; Nylund-Gibson & Choi, 2018; Nylund-Gibson et al., 2019; Wang & Wang, 2019).Footnote 4 According to the approach, (a) an unconditional LPA model is first specified on the basis of the indicator variables. Then, (b) the measurement errors and the most likely class variable of the latent profile C are allocated to the model. Finally, (c) the relationship between profile membership and the distal outcomes is estimated (Dziak et al., 2016). Specifically for Step 3, 10 data sets (i.e., each of which contains one of the 10 sets of plausible values, leaving the other variables the same) were prepared to utilize the PISA plausible values in Mplus (Asparouhov & Muthén, 2010; Yamashita et al., 2020). In this way, 10 analyses with each plausible value were conducted, and the final estimations were derived according to Rubin’s (1987) rules (Baraldi & Enders, 2013; Burns et al., 2022; Muthén & Muthén, 1998–2017; Rohatgi & Scherer, 2020; Mplus Type = IMPUTATION option).
Given the sampling design of PISA described earlier, we applied the final student weights (i.e., W_FSTUWT; Mplus WEIGHT option) and the hierarchical sampling structure (i.e., selecting schools first; cluster = CNTSCHID) to the models (Mplus Type = COMPLEX MIXTURE option). As can be seen from the kurtosis and skewness values in Table 2, the raw data were not normally distributed. Therefore, maximum likelihood estimation with robust standard errors (MLR) was used to address the nonnormality and the possibility of nonindependence in the data (Spurk et al., 2020; Teig et al., 2020). Out of 2,520 students in the sample, four did not fully respond to the test unit (i.e., missing rates = 0.1%; 20 observations/20,160 records of all eight indicators). Despite their small numbers, these missing data were handled with the full information maximum likelihood estimation (i.e., the default in Mplus; Collie et al., 2020; Rohatgi & Scherer, 2020). Following the recommendations in earlier studies (e.g., Berlin et al., 2014; Nylund-Gibson & Choi, 2018; Spurk et al., 2020), we also used multiple starting values to avoid local solution problems. Thus, the models were estimated with at least 5,000 random start values, and the best 500 were retained for the final optimization (Geiser, 2012; Meyer & Morin, 2016; Morin et al., 2011). We report the results from the models that “converged on a replicated solution” (Morin et al., 2011, p. 65).
Model evaluation and selection
We examined multiple criteria and referred to the prior literature to evaluate the candidate models and select the best profile solution. First, we checked whether an error message occurred (Berlin et al., 2014; Spurk et al., 2020). Second, we compared the relative information criteria, such as the Bayesian Information Criterion (BIC), across the candidate models. The lowest values of the relative information criteria suggest the best fitting model (Berlin et al., 2014; Morin et al., 2011; Spurk et al., 2020). Third, we reviewed the level of entropy and average posterior classification probabilities of the models, both of which can represent the confidence level of the classification. If the values for a specific model are closer to 1, its classification accuracy is greater (Berlin et al., 2014; Morin et al., 2011). Fourth, we considered profile sizes. According to Berlin et al. (2014) and Spurk et al. (2020), the profile should be retained if the additional profile consists of (a) greater than or equal to 1% of the total sample or (b) greater than or equal to 25 cases. Fifth, we examined whether a “salsa effect” existed (i.e., “the coercion of [profiles] to fit a population that may not have been latent [profiles]”; Sinha et al., 2021, p. 26). In other words, the effect suggests that the differences in indicators between profiles are shown merely as parallel lines (Sinha et al., 2021). Thus, it indicates unreliable results of the profile analysis. Finally, we validated our identification by testing mean differences in the overall performance across the profile groups, which provided the answers to the second research question (Sinha et al., 2021; Spurk et al., 2020). We further tested mean differences in each indicator across the profile groups using the Wald test (Burns et al., 2022).
Due to limitations of the statistical program, we could not implement the bootstrapped likelihood ratio test (i.e., BLRT) to determine the number of profiles. Moreover, the results from the other alternative tests (e.g., the Lo-Mendell-Rubin test) were not statistically significant, which might be unreliable because our raw data deviated from the default assumption of normality (Guerra-Peña & Steinley, 2016; Spurk et al., 2020). Indeed, such tests for large-scale complex data, as in the current research, have yet to be thoroughly scrutinized (Scherer et al., 2017).
Results
Descriptive statistics and correlations for the behavioral indicators: response times and the number of actions
Prior to identifying the profiles, we checked the descriptive statistics for the indicators, as presented in Table 2. The correlations between the indicators were low to moderate in size overall (Guilford, 1942). Specifically, we found high correlations between the response times in Parts 1 and 2 (r = .63, p < .01) and between the number of actions in Parts 2 and 4 (r = .55, p < .01).
The number of profiles based on the behavioral indicators and their descriptions
The number of latent profiles based on the behavioral indicators
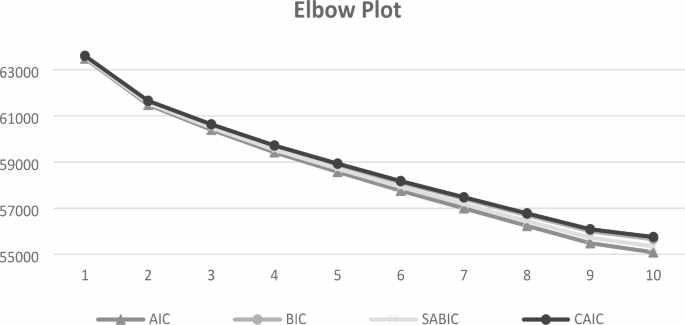
Table 3 shows the model fit statistics across the models with one to 10 profiles specified in this study. As described in the Model Evaluation and Selection section, we evaluated the models on the basis of multiple criteria. First, we did not find any error messages across the 10 models. Second, the log-likelihood values and the relative information criteria (i.e., AIC, BIC, SABIC, CAIC) kept descending with the increase in the number of profiles. The decline in the information criteria can imply the existence of diverse subgroups in the sample in terms of behavioral patterns but can also be natural as the models become more complex (Scherer et al., 2017; Yi & Lee, 2017). Following Morin and Marsh’s (2015) advice to find the best solution, we drew an elbow plot that illustrates the changes in the information criteria with the number of profiles (see Fig. 5). However, unfortunately, it was not easy to identify the flattened point in our case (i.e., the information criteria kept decreasing without the definite point). Third, when relying on a cutoff of 0.80 for entropy, all the models seemed to indicate better fits. Likewise, the average classification probabilities generally showed a satisfactory level of distinctiveness (i.e., over 0.90; Spurk et al., 2020). Next, we considered each model’s profile size, which was the most influential criterion in the end. Using the rule of thumb (Berlin et al., 2014; Spurk et al., 2020), we excluded the models that had a profile that accounted for less than 1% of the sample size or fewer than 25 cases. Then, only the two-profile solution remained. As depicted in Fig. 6, there was no salsa effect between the two profiles. As a result of validation from the Wald tests, the differences in most indicators (i.e., except for the response time indicator in Part 4) and the overall performance between the two profiles were statistically significant (see Table 4). Therefore, the two-profile solution was retained, even though it showed one major proportion (95%) and one small one (5%). The two profiles offered qualitatively contrasting interpretations, which will be discussed later.
Elbow plot of the akaike information criteria (AIC), bayesian information criteria (BIC), sample-size-adjusted bayesian information criteria (SABIC), and consistent akaike information criteria (CAIC)
Profile plot for a two-profile model with estimated mean from the indicators. Note. T represents the response time (with natural log transformation); A indicates the number of actions; each number following T or A means the order of the part (e.g., A2 = the number of actions in Part 2)
The descriptions of the profiles and the differences in the indicators
As mentioned earlier, we extracted two profiles: one large-sized group (N = 2,395, 95%) and one contrasting one (N = 125, 5%). All in all, the latter group of students (N = 125, 5%) exhibited more actions and longer response times, except for the response times in Part 4 (see Figs. 6 and 7). To paraphrase, the first group of students (N = 2,395, 95%) spent more time in Part 4 than the other, although the differences were nonsignificant (p = .51). Interestingly, compared with other indicators for response times and actions, there were fewer disparities between the groups in Part 4 (∆Mresponse time_inverse log = 3005.70; ∆Mactions = 1.47; S.E. = 0.17 and 0.26; ns and p < .01, respectively). Conversely, Part 1 was the stage in which the most distinctive behavioral patterns emerged between the two groups (∆Mresponse time_inverse log = 58466.45; ∆Mactions = 21.54, S.E. = 0.08 and 3.37; ps < 0.01). To compare the two groups, we labeled them Profile 1 (95%) and Profile 2 (5%). We specifically took the inverse of the natural log transformation of response times to distinguish the two groups better and report the results in this subsection (see Table 4).
Table 4 Mean differences in indicators and overall performance between profiles
Profile Plot for a Two-Profile Model With Estimated Mean From the Indicators of Response Time (With Inverse Log Transformation). Note. T represents the response time (with inverse log transformation); each number following T denotes the order of the part (e.g., T2 = the response time in Part 2)
To elaborate on the differences between the two profiles in detail, for actions, we found distinct gaps in Part 1 (∆M = 21.54; S.E. = 3.37; p < .01; Mprofile 1 = 13.41; Mprofile 2 = 34.96) and Part 3 (∆M = 12.23, S.E = 2.21; p < .01; Mprofile 1 = 15.89; Mprofile 2 = 28.12). For response times, we also found the largest gap in Part 1 (∆M = 58466.45; S.E. = 0.08; p < .01; Mprofile 1 = 131006.21; Mprofile 2 = 189472.66). However, the second largest gap was found in Part 2 (∆M = 27454.92; S.E = 0.14; p < .05; Mprofile 1 = 74981.75; Mprofile 2 = 102436.67). Notably, the general trends of time spent and the gap between the two profiles kept diminishing, in contrast to the irregular patterns of action data shown across the four parts.
The differences in the distal outcome between the profiles
As reported earlier, there were significant differences in the distal outcome denoted by the 10 plausible values, the overall performance of ColPS (see Table 4). More precisely, Profile 1 showed better performance on average than Profile 2. The mean performance gap between the two profiles was 129.41 (S.E. = 21.66; p < .01; Mprofile 1 = 519.11; Mprofile 2 = 389.70). Overall, the findings suggest that the participants of the PISA 2015 ColPS assessment (a) who took the assessment in English and (b) who had the Xandar unit as the first cluster could be divided into two distinct profiles (RQ1). Additionally, their ColPS performance was also partly related to their profile membership and its differentiation (RQ2). Profile 1 accounted for 95% of the total and could usually be characterized by better performance with fewer actions and shorter response times. By contrast, the second latent profile (i.e., 5% of the total) generally displayed more actions and longer response times with lower performance.
Discussion
The objective of this study was to identify students’ behavioral patterns and the relationships between these patterns and the overall ColPS outcomes. To attain this objective, we based the LPA on two aspects of behavioral process data collected from the PISA 2015 ColPS assessment participants: (a) response time and (b) the number of actions. To our knowledge, this study is one of the first investigations into how process data from the PISA 2015 ColPS assessment can be used to identify test-takers’ profiles, which were collected via a computer-based environment with the H-A approach (cf. De Boeck & Scalise, 2019). Therefore, this study extends current research by offering information about students’ ColPS processes, in addition to the assessment results.
The profiles of students’ response times and actions during ColPS (RQ1)
Through the LPA, we found evidence for two distinct profiles. The Profile 1 group accounted for most of our sample (95%). Such disproportionate results could be due to the limitations of the tasks the students engaged in or the students’ characteristics (i.e., they had similar proficiency levels), which should be investigated further and will be elaborated on later (see the Limitations and Future Directions section). Nevertheless, the differences in most indicators were significant (except for the response times in Part 4). The information about the profiles suggests that the students’ different behaviors and approaches to engaging in ColPS with the agents were associated with students’ performance levels and can be referenced for future research, assessments, and interventions on ColPS.
With respect to the actions, the students from Profile 2 displayed more actions than the others, and we specifically found considerable divergences between the two profiles in Part 1. As explained earlier, in Part 1, participants establish common strategies for ColPS and familiarize themselves with the assessment unit (De Boeck & Scalise, 2019). In this situation, students explore and co-elaborate on the problem space with the agents, thereby obtaining a better understanding (Pöysä-Tarhonen et al., 2022). These processes are the “essence of collaboration” (Van den Bossche et al., 2011, p. 284) because the shared understanding and representations will act as a steppingstone for coordinating the diverse perspectives within a team (Fiore & Schooler, 2004; Van den Bossche et al., 2011). Our results suggest that the students in Profile 1 established the common presentation as a team and figured out how best to achieve the goal efficiently in Part 1, whereas the students in Profile 2 failed to do so, leading to more unnecessary actions and more time to respond. The reasons they needed to explore the problems repeatedly and for a relatively long time may be related to a single team mental model or to the mixture of models (i.e., the equipment, task, team interaction, and team models; Cannon-Bowers et al., 1993). However, it is not easy to conclude which mental models and the extent of their (dis)similarities are related to the different behavioral patterns identified in this context.
Given the limited time of the assessment, if students fail Part 1 in an unstructured way (i.e., as the Profile 2 group’s patterns indicated), their subsequent processes were likely to be hampered, which could be seen in the conspicuous differences in their actions in Part 3. In Part 3, students respond to the questions assigned to them (i.e., about the geography of Xandar) and the uncooperative actions of the agents. As demonstrated, the two profiles’ actions showed the second largest disparities in this part. The students in Profile 2 displayed almost two times as many actions as the other profile. This result indicates that the Profile 2 students implemented “an impulsive and fast trial-and-error” approach, in line with what De Boeck and Scalise (2019) reported.
There are several possible explanations for such results in Part 3. First, as noted earlier, the results could be due to a failure to build a shared understanding and reach an agreement in previous parts. In other words, because of the (even partially) inaccurate team mental models, the students with Profile 2 could engage in many actions to catch up with the ColPS process and redress the gaps in their mental models. For instance, it is possible that they had a shared understanding with the computer agents about the given tasks but were not on the same page about how to tackle them (e.g., assigned roles and responsibilities; Fiore & Schooler, 2004; Mulder, 1999; Van den Bossche et al., 2011). Unless they disengaged during the tasks, they were likely to click multiple times in an attempt to quickly figure out how to proceed. In this case (e.g., when “team members’ understanding of task priorities is shared, but misguided”; Lim & Klein, 2006, p. 406), ColPS processes could be ineffective, as shown by a substantive number of actions in our results. Chung et al.’s (1999) findings resonate with this explanation. They found that low-performing teams exchanged more-defined messages during their knowledge mapping task, which suggests that the low-performing teams might not have benefitted from the discussions, notwithstanding many exchanges. However, our results are inconsistent with Jeong and Chi (2007), who reported that more interactions were responsible for common knowledge construction. These mixed results might be induced by differences, for example, in tasks and settings (i.e., collaborative text comprehension in the H-H setting with free conversation). For example, disparate problem tasks may require different thresholds and upper limits of efficient interactions (i.e., actions) to accurately construct team mental models, set effective boundaries between their homogeneities and heterogeneities, and share them completely. These agendas should be delved into more in future studies.
Related to the above but slightly different, the students from Profile 2 might have succeeded in establishing the shared understanding but might not have capitalized on it. In other words, they might have failed to maintain the pre-established mental models until Part 3, one reason for which they did not deliberate on them or come to a complete agreement but did not want to reveal their misunderstanding. Accordingly, they might have adopted the quick trial-and-error approach in this part. As pointed out by Jeong and Chi (2007), what was shared within the team does not necessarily correspond to what team members agreed on. Thus, more research is needed to examine whether the mental models were (in)accurately kept and fully agreed upon and influenced the identified disparities in actions, via measurements at multiple points (Kozlowski & Chao, 2012).
Nevertheless, regardless of whether the students established and maintained a shared understanding, the students in Profile 2 might not have familiarized themselves with the assessment environment sufficiently before moving on to Part 3. For instance, they might have been less familiar with the computer-based assessment environment due to having inadequate information and communication technologies (ICT) literacy and might consequently have engaged in a large number of actions. As we did not include any covariates in the model in the current research, further analysis should be conducted, including potential factors of influence and their interactions and applying an intersectional perspective to judge the validity of this interpretation.
On the one hand, our results imply that the students with Profile 2 might have been engaged across the entire assessment, given the remarkable number of actions. The number can be understood as the level of engagement with the tasks, as Greiff et al. (2018) suggested. In the study of a computer-based complex problem-solving assessment, they proposed that the number of actions could indicate “deeper and longer engagement with the tasks” (p. 251). However, one difference between their study and the current one is the thoroughness of the explorations, which might be ascribed to the differences in the assessment tool and the construct of interest. As mentioned above, in the context of the Xandar unit, too many exploration steps suggest a shallowness of the exploration, that is, a failure to establish, agree upon, or maintain a shared understanding. Nevertheless, as noted earlier, the extent to which an appropriate number of actions is important for being a good collaborator in this task should be investigated further. Triangulating the number of actions with other data (e.g., physiological metrics, think-aloud data, or survey results) will be one way to determine the thresholds and upper limits of efficient actions as well as students’ levels of engagement during this unit.
Turning to time-related aspects, the students with Profile 2 took more time across the assessment than the other group, except for Part 4. However, the overall trend for the time spent on the tasks kept decreasing for both profiles. This trend could indicate the levels of students’ engagement. In other words, the participants of both profiles might have shown more rapid guesses (i.e., “response occurring faster than an item’s threshold”) in the later part of the 30-min ColPS assessment, which should be further examined (Wise et al., 2009, p.187; see also OECD, 2023). Notably, the gap in the response times between the two profiles also kept declining. These results suggest that both profiles might have become accustomed to the assessment environment, tasks, and collaboration processes as time went by. This waning pattern is in contrast to the irregular trend in the action data. It is more interesting to see the patterns when considering the numbers of items and their levels of difficulty in each part. For instance, comparing Parts 3 and 4, each of which consists of two items, it would be natural to spend more time in Part 3 because Part 3 has the item with the highest difficulty (i.e., 992 in Part 3).
Of the patterns we identified, we found the most noticeable disparities in response times between the two profiles in Part 1— and likewise for the actions. Given the item difficulty in this part (i.e., from 314 to 524; see Fig. 1), it would be interesting to figure out why the considerable differences in response times emerged here. One possible explanation is that it was the stage in which students are supposed to explore and co-elaborate on the given tasks without any pre-existing procedures or strategies, as mentioned earlier (Pöysä-Tarhonen et al., 2022). Particularly, in this part, students should lead the way by proposing a strategy for assigning responsibilities (i.e., Item 4; OECD, 2016), which could allow some of them to ponder how to do it. In addition, students should be getting used to the assessment environment in Part 1 (De Boeck & Scalise, 2019). Accordingly, students are more likely to exhibit differences in the time they spend in Part 1, depending on their proficiency in establishing a shared understanding and adapting themselves to the assessment.
Another interesting point to mention is with respect to Part 2, where we observed another significant difference in response times between the two profiles. As in Part 1, students continued to establish what the team models had in common, particularly on the roles and responsibilities of team members, factoring in their expertise and skills. Thus, for the same reason as above, it was very likely that differences in response times would be exhibited between the two profiles here. Specifically, the differences could be related to the conflict that arises between the agents at the beginning of this part (i.e., Item 6 with the difficulty of 598; OECD, 2016). This conflict requires students to seek members’ perspectives and negotiate solutions (OECD, 2016), but it might not be easy for students in Profile 2, which thus makes them expend a great deal of time clicking on incorrect messages (i.e., they engage in a large number of actions) or contemplating. However, the effect of this item on the response times should be scrutinized in the future. Unfortunately, the current form of the PISA 2015 ColPS assessment does not provide public information about process data at the item level.
To capitulate briefly, the identified profiles are different in the behavioral patterns of the action and time data collected for each part of the assessment. However, we could not provide unequivocal conclusions due to the limited amount of information. As Goldhammer et al. (2021) highlighted, there is a need for more science-backed and contextual evidence and information in order to provide definite explanations.
Differences in performance between the extracted profiles (RQ2)
In the current research, we found a significant relationship between profile membership and overall performance in the PISA 2015 ColPS assessment. There were significant mean differences in achievement between the two profiles. That is, Profile 1 (95%) outperformed the other. From a measurement standpoint, such results show that, based on the sample from the Xandar unit of PISA 2015, the identified behavioral patterns and the two types of process data can be utilized to identify students’ ColPS proficiencies to some extent. As described earlier, the part that differentiated the most between the profiles was Part 1. Given the general guidelines on how to assign the target weights to the target skills of the PISA 2015 ColPS framework (see Fig. 1; OECD, 2017a), higher weights were allocated to the items in Part 1. Thus, it can be concluded that the behavioral patterns in Part 1 were what best determined the differences in performance between the profiles. Put differently, a structured approach leads to better performance than the trial-and-error approach in Part 1 of the Xandar unit, a finding that is consistent with De Boeck and Scalise (2019).
Conversely, there is a slight inconsistency between De Boeck and Scalise (2019) and our study, particularly regarding Part 4, where monitoring and reflecting processes were involved. They found significant positive relationships between the actions, response times, and performance in Part 4. In contrast to them, we found that (a) Profile 1 (i.e., the high-performing group) engaged in fewer actions than Profile 2 (i.e., the low-performing group) in this part. Additionally, (b) the differences in the time devoted here were not statistically significantly different, although the students in Profile 1 expended more time here than Profile 2 did. These disparities may have multiple reasons. First, we extended the sample of students (i.e., students with diverse nationalities, including the United States) compared with De Boeck and Scalise’s study. Thus, the unknown differences in students’ characteristics, such as personalities, working styles, dispositions on ColPS, ICT skills, or cultural values, may have influenced the observed behavioral patterns and led to differences between the studies. Given the purpose and content of the part, their findings and interpretation seem reasonable. However, provided that the earlier stages are well-implemented, that is, team mental models are well-established and shared, the processes for monitoring and reflecting may be done with fewer actions in an organized way. It can be assumed that the participants in our sample show this point more clearly than in De Boeck and Scalise’s study.
From a construct and training perspective, our findings spotlight the importance of the subcompetency of ColPS called Establishing and maintaining a shared understanding. Our findings are consistent with points that have already been emphasized in numerous previous studies (e.g., Andrews-Todd et al., 2017; Van den Bossche et al., 2011). Overall and specifically for such a competency, we found that the organized approach used by the students in Profile 1 was associated with better performance than the other profile’s approach, which involved trial and error. Although the relationship between the observed behavioral patterns and overall performance cannot be generalized because our sample was limited and we analyzed only a single task unit, our findings can be used as a reference for training students in ColPS. For instance, when designing instruction in ColPS, enough time and facilitating tools should be provided to establish a shared understanding, such as visual support or meta-cognitive questions, particularly in the early stage of ColPS (Dindar et al., 2022; Gergle et al., 2013; Newton et al., 2018). Furthermore, given that ColPS processes can be iterative in reality, it is recommended that students revisit the established common understanding and recognize any gaps in their understanding if problems occur in the middle of ColPS (e.g., “What might your teammate know that you need to know?”, see the guiding questions in Table 2 in Newton et al., 2018, p. 47). In addition, since the findings can be related to the level of students’ engagement, it will be worthwhile considering ample scaffolding for the later parts of ColPS and effective assessment design (OECD, 2023; Wise et al., 2009). If more diverse types of ColPS tasks, process data, participants, and their backgrounds can be investigated in the future, more practical guidelines can be established (Greiff & Borgonovi, 2022).
Limitations and future directions
There are several limitations in this exploratory study. First, the results should be considered to reflect the socioeconomic and cultural contexts of the populations included in the study and should not be assumed to generalize beyond them. In particular, most of the countries in the sample were fairly high-achieving, with students obtaining better scores than the international average (see Table 1). We tried to control for the potential effects of languages and selected the participants who took the assessment in English, thereby analyzing a limited range of proficiency levels. A different set of profiles might be identified if such a study is conducted on a different sample of countries with diverse social contexts (e.g., cultural values or the perceptions of the test) because the social and economic contexts individuals experience might affect respondents’ behavioral patterns (e.g., differences in cognitive processes or test-taking motivation and preferences for specific tactics; Borgonovi & Biecek, 2016; He et al., 2021; Xu et al., 2021). Indeed, there is evidence that the students from Hong Kong show different response processes, for instance, in Item 11 of the Xandar unit (see Annex G in OECD, 2017c). Future research could investigate behavioral profiles using a more diverse set of countries and student populations that differ in cultural or ethnic backgrounds and could compare the (dis)similarities between the extracted profiles across diverse backgrounds based on the item-level information (e.g., Morin et al., 2016).
Second, we did not include covariates that may be associated with the profiles, and we conducted a single-level LPA. On the basis of the previous literature, it will be possible to get ideas for potential predictors of profile membership, such as gender, students’ ICT skills, self-perceived collaboration, and teamwork dispositions (Scalise et al., 2016) or school-level variables, including schools’ socioeconomic status (Tang et al., 2021). As noted earlier, the variables related to the different cultural backgrounds can also be included as covariates. Thus, it could be possible to include the potential covariates and examine their effects on profile membership in future analyses, thereby ensuring valid interpretations of the results (e.g., the effects of students’ ICT use and socioeconomic backgrounds; Borgonovi & Pokropek, 2021; Maddox, 2023). Furthermore, multilevel LPAs can be implemented to derive more definitive explanations, such as the use of school-level variables (e.g., Collie et al., 2020).
Third, from a statistical standpoint, more investigations of large-scale assessment data sets need to be conducted with LPA. As mentioned earlier, we encountered some problems, potentially due to the non-normality of the indicators and the complex structure of the data set. Although we took steps to mitigate the degree of non-normality (i.e., adopting the MLR estimator and the log transformation of some indicators), the high level of non-normality might influence the analytical procedures and findings. Furthermore, because we had to account for the nested structure of the samples, we could not apply a widely used statistical test (i.e., the BLRT test) to determine the number of profiles, but this avenue should be examined more in the future (Scherer et al., 2017). The local independence between the response time and action data from the PISA 2015 ColPS assessment should also be scrutinized further, as local independence is an underlying assumption for LPA. However, because there is little research on the topic of such indicators, we had to rely on the levels of correlation coefficients and conduct sensitivity analyses. Therefore, further analyses based on more scientific and statistically stricter verifications are needed in the future.
Fourth, the behavioral indicators used in this study are tailored to one specific assessment unit that was based on the H-A approach in a computer-based assessment. As we relied on only one test unit, which partially covered the 12 skills and utilized computer agents, it is impossible to generalize our results. The specific assessment setting (i.e., exchanging predefined messages with computer agents about a certain problem-solving scenario) might not elicit behaviors that are as varied or as free-flowing as the behaviors that would occur in real ColPS situations. Furthermore, nonidentical types of collaboration can achieve different purposes, which may consequently lead to heterogenous behavioral patterns (Graesser et al., 2018; Han et al., 2021; Kapur, 2011). According to the OECD (2017a, p. 23), there might be other units in PISA 2015 involving different tasks (e.g., “group decision-making” or “group-production tasks”). Therefore, further investigations should be conducted on the data from the other test units, and the findings should be compared with other ColPS studies to validate the current and previous findings. For instance, we can gain more insights into the levels of students’ engagement by implementing another LPA on the next test unit and comparing the number of actions in the first part.
Lastly, the indicators used in this study indicate the total number of actions and the total response times in each of the various parts of the assessment (i.e., not on the item level) and are only two types of data, whose use and interpretation needs to be validated further (Zumbo et al., 2023). That is, we were able to utilize only the total number of actions and the response times for each part due to the constraints of the available data. We do not even know the contents of actions, which could be mistakes, help-seeking behaviors, or task-related behaviors. Likewise, what occurred during the time participants took to respond is unknown. Furthermore, the response time indicators in this study were calculated when students worked on an item for the last time. Thus, it might not always correspond to the total time spent on an item, such as when students moved back and forth across the items (OECD, 2019). If more information (e.g., at the item level) is provided and utilized, response sequences within/across test units can be investigated to better understand the behavioral patterns (e.g., Han & Wilson, 2022; He et al., 2021; He et al., 2022). It may also be possible to examine the specific number of thresholds and upper limits for effective behavioral patterns with respect to the shared mental models and the extent of their similarities and dissimilarities. Triangulations based on more diverse types of process data can also be considered by using additional apparati (e.g., eye movements, Maddox et al., 2018; chats, Shaffer et al., 2016) to validate the results (and the utilized process data) and to gain a better understanding of the behaviors (Maddox, 2023; Zumbo et al., 2023). Such research should be grounded in theoretical and analytical considerations of process data—including the validity, fairness, and reliability of their use, the given assessment settings, purposes, and participants—established in the design and development stage of the assessment (He et al., 2021, 2022; Maddox, 2023; Zumbo et al., 2023).
Conclusion
We conducted an LPA to shed light on students’ ColPS behavioral patterns, based on two types of process data (i.e., response times and the number of actions) measured in the PISA 2015 ColPS assessment, specifically for those who (a) took the assessment in English and (b) had the Xandar unit as the first cluster (N = 2,520). The results confirmed the presence of two distinguishable groups of students (i.e., Profile 1 [95%] vs. Profile 2 [5%]) with different behavioral patterns. We further confirmed that the disparities in behaviors were statistically significantly related to students’ overall ColPS performance. Thus, more organized and goal-driven behaviors (i.e., less time and actions) were associated with better performance than the trial-and-error-based approach (i.e., more time and actions) across the Xandar unit of PISA 2015. Whereas there is a need for further research that is aligned with diverse populations and types of process data, different tasks and covariates, and more contextual information for validation and triangulation, these exploratory findings provide initial insights into successful ColPS, extend the relevant extant literature, and hence serve researchers, policymakers, and practitioners.
In the main PISA 2015 assessment, there were two modes: paper-based and computer-based. The domain of ColPS was included in only the computer-based mode (see OECD, 2017c).
Note that English-speaking samples from Scotland, Malaysia, and Cyprus were not included in the current study. Reviewing the data and information, we confirmed that Scotland is part of the sample of the United Kingdom. Cyprus data were not in the PISA international database and had to be requested ad hoc to the Cypriotic authorities. We decided not to pursue this avenue because we worried about data quality for process data since the dataset has not undergone the same level of scrutiny that is standard for the international database. We were also concerned about reproducibility since researchers would not be able to replicate our findings. Lastly, Malaysia was included alongside Kazakhstan and Argentina separately from the other countries and with a note in the PISA reports and publications because coverage in Malaysia was deemed too small to ensure comparability. Thus, we decided not to include Malaysia because response rates problems may mean that the sample is selected and contains bias in like with the OECD recommendations.
Note that we conducted sensitivity analyses on three data sets that differed in the method applied to exclude outliers. In addition to the robust Mahalanobis distance estimation, we implemented the basic Mahalanobis distance estimation from which 92 outliers were identified (i.e., the final sample had N = 2,967; Leys et al., 2018), and we deleted six inactive students without applying any outlier detection procedure (i.e., the final sample had N = 3,059). Comparing the fit indices between the different data sets, the results of the robust Mahalanobis distance estimation showed the best indices in Step 1 of the three-step approach. Consequently, in further analytic steps, we decided to use the data set from which we excluded the outliers on the basis of the robust estimation.
Note that we also tried the BCH approach (see Asparouhov & Muthén, 2021; Bakk & Vermunt, 2016), a more advanced method, but it failed with errors in Step 3. Accordingly, we stuck to the three-step approach. For a comprehensive discussion of the BCH and the three-step approaches, see Nylund-Gibson et al. (2019).
References
Andrews-Todd, J. J., Kerr, D., Mislevy, R. J., von Davier, A., Hao, J., & Liu, L. (2017). Modeling collaborative interaction patterns in a simulation-based task. Journal of Educational Measurement, 54(1), 54–69. https://doi.org/10.1111/jedm.12132.
Andrews-Todd, J. J., Forsyth, C., Steinberg, J., & Rupp, A. (2018). Identifying profiles of collaborative problem solvers in an online electronics environment. Proceedings of the 11th International Conference on Educational Data Mining (EDM’18), 16–18 July 2018, Raleigh, NC, USA (pp. 239–245). https://eric.ed.gov/?id=ED593219.
Asparouhov, T. (2005). Sampling weights in latent variable modeling. Structural Equation Modeling: A Multidisciplinary Journal, 12(3), 411–434. https://doi.org/10.1207/s15328007sem1203_4.
Asparouhov, T., & Muthén, B. (2015). Residual associations in latent class and latent transition analysis. Structural Equation Modeling: A Multidisciplinary Journal, 22(2), 169–177. https://doi.org/10.1080/10705511.2014.935844.
Asparouhov, T., & Muthén, B. (2021). Auxiliary variables in mixture modeling: Using the BCH method in Mplus to estimate a distal outcome model and an arbitrary secondary model. https://www.statmodel.com/examples/webnotes/webnote21.pdf.
Bakk, Z., & Vermunt, J. K. (2016). Robustness of stepwise latent class modeling with continuous distal outcomes. Structural Equation Modeling: A Multidisciplinary Journal, 23(1), 20–31. https://doi.org/10.1080/10705511.2014.955104.
Baraldi, A. N., & Enders, C. K. (2013). Missing data methods. In T. D. Little (Ed.), The Oxford handbook of quantitative methods: Statistical analysis (pp. 635–664). Oxford University Press.
Berlin, K. S., Williams, N. A., & Parra, G. R. (2014). An introduction to latent variable mixture modeling (part 1): Overview and cross-sectional latent class and latent profile analyses. Journal of Pediatric Psychology, 39(2), 174–187. https://doi.org/10.1093/jpepsy/jst084.
Borgonovi, F., & Biecek, P. (2016). An international comparison of students’ ability to endure fatigue and maintain motivation during a low-stakes test. Learning and Individual Differences, 49, 128–137. https://doi.org/10.1016/j.lindif.2016.06.001.
Borgonovi, F., & Pokropek, M. (2021). The evolution the association between ICT use and reading achievement in 28 countries. Computers and Education Open, 2, 1–13. https://doi.org/10.1016/j.caeo.2021.100047.
Burns, E. C., Collie, R. J., Bergen, P. V., & Martin, A. J. (2022). Intrapersonal and interpersonal psychosocial adjustment resources and achievement: A multilevel latent profile analysis of students and schools. Journal of Educational Psychology, 114(8), 1912–1930. https://doi.org/10.1037/edu0000726.
Cannon-Bowers, J. A., Salas, E., & Converse, S. (1993). Shared mental models in expert team decision making. In N. J. Castellan Jr. (Ed.), Individual and group decision making: Current issues (pp. 221–246). Lawrence Erlbaum Associates Publishers.
Chang, C. J., Chang, M. H., Chiu, B. C., Liu, C. C., Fan Chiang, S. H., Wen, C. T., Hwang, F. K., Wu, Y. T., Chao, P. Y., Lai, C. H., Wu, S. W., Chang, C. K., & Chen, W. (2017). An analysis of student collaborative problem solving activities mediated by collaborative simulations. Computers & Education, 114, 222–235. https://doi.org/10.1016/j.compedu.2017.07.008.
Child, S. F. J., & Shaw, S. (2019). Towards an operational framework for establishing and assessing collaborative interactions. Research Papers in Education, 34(3), 276–297. https://doi.org/10.1080/02671522.2018.1424928.
Chung, G. K. W. K., O’Neil, H. F., & Herl, H. E. (1999). The use of computer-based collaborative knowledge mapping to measure team processes and team outcomes. Computers in Human Behavior, 15(3–4), 463–493. https://doi.org/10.1016/S0747-5632(99)00032-1.
Collie, R. J., Malmberg, L. E., Martin, A. J., Sammons, P., & Morin, A. J. S. (2020). A multilevel person-centered examination of teachers’ workplace demands and resources: Links with work-related well-being. Frontiers in Psychology, 11, 1–19. https://doi.org/10.3389/fpsyg.2020.00626.
De Boeck, P., & Scalise, K. (2019). Collaborative problem solving: Processing actions, time, and performance. Frontiers in Psychology, 10, 1–9. https://doi.org/10.3389/fpsyg.2019.01280.
Dindar, M., Järvelä, S., Nguyen, A., Haataja, E., & Çini, A. (2022). Detecting shared physiological arousal events in collaborative problem solving. Contemporary Educational Psychology, 69, 1–13. https://doi.org/10.1016/j.cedpsych.2022.102050.
Dowell, N. M. M., Nixon, T. M., & Graesser, A. C. (2018). Group communication analysis: A computational linguistics approach for detecting sociocognitive roles in multiparty interactions. Behavior Research Methods, 51, 1007–1041. https://doi.org/10.3758/s13428-018-1102-z.
Dziak, J. J., Bray, B. C., Zhang, J., Zhang, M., & Lanza, S. T. (2016). Comparing the performance of improved classify-analyze approaches for distal outcomes in latent profile analysis. Methodology, 12(4), 107–116. https://doi.org/10.1027/1614-2241/a000114.
Ercikan, K., Guo, H., & He, Q. (2020). Use of response process data to inform group comparisons and fairness research. Educational Assessment, 25(3), 179–197. https://doi.org/10.1080/10627197.2020.1804353.
Fiore, S. M., & Schooler, J. W. (2004). Process mapping and shared cognition: Teamwork and the development of shared problem models. In E. Salas & S. M. Fiore (Eds.), Team cognition: Understanding the factors that drive process and performance (pp. 133–152). American Psychological Association. https://doi.org/10.1037/10690-007.
Geiser, C. (2012). Data analysis with Mplus. Guilford publications.
Gergle, D., Kraut, R. E., & Fussell, S. R. (2013). Using visual information for grounding and awareness in collaborative tasks. Human-Computer Interaction, 28(1), 1–39. https://doi.org/10.1080/07370024.2012.678246.
Goldhammer, F., & Zehner, F. (2017). What to make of and how to interpret process data. Measurement: Interdisciplinary Research and Perspectives, 15(3–4), 128–132. https://doi.org/10.1080/15366367.2017.1411651.
Goldhammer, F., Naumann, J., Stelter, A., Tóth, K., Rölke, H., & Klieme, E. (2014). The time on task effect in reading and problem solving is moderated by task difficulty and skill: Insights from a computer-based large-scale assessment. Journal of Educational Psychology, 106(3), 608–626. https://doi.org/10.1037/a0034716.
Goldhammer, F., Hahnel, C., & Kroehne, U. (2020). Analysing log file data from PIAAC. In D. Maehler & B. Rammstedt (Eds.), Large-scale cognitive assessment: Analyzing PIAAC data (pp. 239–269). Springer. https://doi.org/10.1007/978-3-030-47515-4_10.
Goldhammer, F., Hahnel, C., Kroehne, U., & Zehner, F. (2021). From byproduct to design factor: On validating the interpretation of process indicators based on log data. Large-Scale Assessments in Education, 9, 1–25. https://doi.org/10.1186/s40536-021-00113-5.
Gottschling, J., Krieger, F., & Greiff, S. (2022). The fight against infectious Diseases: The essential role of higher-order thinking and problem-solving. Journal of Intelligence, 10(1), 1–8. https://doi.org/10.3390/jintelligence10010014.
Graesser, A. C., Fiore, S. M., Greiff, S., Andrews-Todd, J., Foltz, P. W., & Hesse, F. W. (2018). Advancing the science of collaborative problem solving. Psychological Science in the Public Interest, 19(2), 59–92. https://doi.org/10.1177/1529100618808244.
Greiff, S., & Borgonovi, B. (2022). Teaching of 21st century skills needs to be informed by psychological research. Nature Reviews Psychology, 1, 314–315. https://doi.org/10.1038/s44159-022-00064-w.
Greiff, S., Molnár, G., Martin, R., Zimmermann, J., & Csapó, B. (2018). Students’ exploration strategies in computer-simulated complex problem environments: A latent class approach. Computers & Education, 126, 248–263. https://doi.org/10.1016/j.compedu.2018.07.013.
Guerra-Peña, K., & Steinley, D. (2016). Extracting spurious latent classes in growth mixture modeling with nonnormal errors. Educational and Psychological Measurement, 76(6), 933–953. https://doi.org/10.1177/0013164416633735.
Guilford, J. P. (1942). Fundamental statistics in psychology and education. McGraw-Hill.
Han, Y., & Wilson, M. (2022). Analyzing student response processes to evaluate success on a technology-based problem-solving task. Applied Measurement in Education, 35(1), 33–45. https://doi.org/10.1080/08957347.2022.2034821.
Han, A., Krieger, F., & Greiff, S. (2021). Collaboration analytics need more comprehensive models and methods. An opinion paper. Journal of Learning Analytics, 8(1), 13–29. https://doi.org/10.18608/jla.2021.7288.
Han, A., Krieger, F., & Greiff, S. (2023). Assessment of collaborative problem-solving: Past achievements and current challenges. In R. J. Tierney, F. Rizvi, & K. Erkican (Eds.), International Encyclopedia of Education (4th ed., pp. 234–244). Elsevier. https://doi.org/10.1016/B978-0-12-818630-5.09041-2.
Hao, J., & Mislevy, R. J. (2019). Characterizing interactive communications in computer-supported collaborative problem-solving tasks: A conditional transition profile approach. Frontiers in Psychology, 10, 1–9. https://doi.org/10.3389/fpsyg.2019.01011.
He, Q., Borgonovi, F., & Paccagnella, M. (2021). Leveraging process data to assess adults’ problem-solving skills: Using sequence mining to identify behavioral patterns across digital tasks. Computers & Education, 166, 1–14. https://doi.org/10.1016/j.compedu.2021.104170.
He, Q., Borgonovi, F., & Suárez-Álvarez, J. (2022). Clustering sequential navigation patterns in multiple-source reading tasks with dynamic time warping method. Journal of Computer Assisted Learning, 1–18. https://doi.org/10.1111/jcal.12748.
Herborn, K., Mustafić, M., & Greiff, S. (2017). Mapping an experiment-based assessment of collaborative behavior onto collaborative problem solving in PISA 2015: A cluster analysis approach for collaborator profiles. Journal of Educational Measurement, 54(1), 103–122. https://doi.org/10.1111/jedm.12135.
Hickendorff, M., Edelsbrunner, P. A., McMullen, J., Schneider, M., & Trezise, K. (2018). Informative tools for characterizing individual differences in learning: Latent class, latent profile, and latent transition analysis. Learning and Individual Differences, 66, 4–15. https://doi.org/10.1016/j.lindif.2017.11.001.
Hubley, A. M., & Zumbo, B. D. (2017). Response processes in the context of validity: Setting the stage. In B. D. Zumbo & A. M. Hubley (Eds.), Understanding and investigating response processes in validation research (pp. 1–12). Springer. https://doi.org/10.1007/978-3-319-56129-5_1.
Jeong, H., & Chi, M. T. H. (2007). Knowledge convergence and collaborative learning. Instructional Science, 35(4), 287–315. http://www.jstor.org/stable/41953741.
Kang, J., An, D., Yan, L., & Liu, M. (2019). Collaborative problem-solving process in a science serious game: Exploring group action similarity trajectory. Proceedings of the 12th International Conference on Educational Data Mining, 336–341. https://files.eric.ed.gov/fulltext/ED599182.pdf.
Kapur, M. (2011). Temporality matters: Advancing a method for analyzing problem-solving processes in a computer-supported collaborative environment. International Journal of Computer-Supported Collaborative Learning, 6, 39–56. https://doi.org/10.1007/s11412-011-9109-9.
Khorramdel, L., von Davier, M., Gonzalez, E., & Yamamoto, K. (2020). Plausible values: Principles of item response theory and multiple imputations. In D. B. Maehler & B. Rammstedt (Eds.), Large-scale cognitive assessment: Analyzing PIAAC Data (pp. 27–47). Springer. https://doi.org/10.1007/978-3-030-47515-4_3.
Kozlowski, S. W. J., & Chao, G. T. (2012). The dynamics of emergence: Cognition and cohesion in work teams. Managerial & Decision Economics, 33(5–6), 335–354. https://doi.org/10.1002/mde.2552.
Leys, C., Klein, O., Dominicy, Y., & Ley, C. (2018). Detecting multivariate outliers: Use a robust variant of the mahalanobis distance. Journal of Experimental Social Psychology, 74, 150–156. https://doi.org/10.1016/j.jesp.2017.09.011.
Li, Z., Banerjee, J., & Zumbo, B. D. (2017). Response time data as validity evidence: Has it lived up to its promise and, if not, what would it take to do so. In B. D. Zumbo & A. M. Hubley (Eds.), Understanding and investigating response processes in validation research (pp. 159–177). Springer. https://doi.org/10.1007/978-3-319-56129-5_9.
Li, C. H., Tsai, P. L., Liu, Z. Y., Huang, W. C., & Hsieh, P. J. (2021). Exploring collaborative problem solving behavioral transition patterns in science of Taiwanese students at age 15 according to mastering levels. Sustainability, 13(15), 1–15. https://doi.org/10.3390/su13158409.
Lim, B. C., & Klein, K. J. (2006). Team mental models and team performance: A field study of the effects of team mental model similarity and accuracy. Journal of Organizational Behavior, 27(4), 403–418. https://doi.org/10.1002/job.387.
Maddox, B. (2023). The uses of process data in large-scale educational assessments (OECD Education Working Paper No. 286). https://doi.org/10.1787/5d9009ff-en.
Maddox, B., Bayliss, A. P., Fleming, P., Engelhardt, P. E., Edwards, S. G., & Borgonovi, F. (2018). Observing response processes with eye tracking in international large-scale assessment: Evidence from the OECD PIAAC assessment. European Journal of Psychology of Education, 33, 543–558. https://doi.org/10.1007/s10212-018-0380-2.
Meyer, J. P., & Morin, A. J. S. (2016). A person-centered approach to commitment research: Theory, research, and methodology. Journal of Organizational Behavior, 37(4), 584–612. https://doi.org/10.1002/job.2085.
Morin, A. J. S., & Marsh, H. W. (2015). Disentangling shape from level effects in person-centered analyses: An illustration based on university teachers’ multidimensional profiles of effectiveness. Structural Equation Modeling: A Multidisciplinary Journal, 22(1), 39–59. https://doi.org/10.1080/10705511.2014.919825.
Morin, A. J. S., Morizot, J., Boudrias, J. S., & Madore, I. (2011). A multifoci person-centered perspective on workplace affective commitment: A latent profile/factor mixture analysis. Organizational Research Methods, 14(1), 58–90. https://doi.org/10.1177/1094428109356476.
Morin, A., Mayer, J. S., Creusier, J. P., J., & Biétry, F. (2016). Multiple-group analysis of similarity in latent profile solutions. Organizational Research Methods, 19(2), 231–254. https://doi.org/10.1177/1094428115621148.
Muthén, L. K., & Muthén, B. O. (1998–2017). Mplus user’s guide (8th ed.) Muthén & Muthén.
National Council on Measurement in Education [AERA, APA, & NCME]. (2014). Standards for educational and psychological testing. American Educational Research Association.
Newton, O., Wiltshire, T. J., & Fiore, S. M. (2018). Macrocognition in teams and metacognition: Developing instructional strategies for complex collaborative problem solving. In J. Johnston, R. Sottilare, A. M. Sinatra, & C. S. Burke (Eds.), Building intelligent tutoring systems for teams: What matters (Vol. 19, pp. 33–54). Emerald Publishing. https://doi.org/10.1108/S1534-085620180000019006.
Nylund-Gibson, K., & Choi, A. Y. (2018). Ten frequently asked questions about latent class analysis. Translational Issues in Psychological Science, 4(4), 440–461. https://doi.org/10.1037/tps0000176.
Nylund-Gibson, K., Grimm, R. P., & Masyn, K. E. (2019). Prediction from latent classes: A demonstration of different approaches to include distal outcomes in mixture models. Structural Equation Modeling: A Multidisciplinary Journal, 26(6), 967–985. https://doi.org/10.1080/10705511.2019.1590146.
Organization for Economic Co-operation and Development (2017b). PISA 2015 results: Collaborative problem solving (Volume V). https://doi.org/10.1787/9789264285521-en.
Organization for Economic Co-operation and Development (2016). Description of the released unit from the 2015 PISA collaborative problem-solving assessment, collaborative problem-solving skills, and proficiency levels. https://www.oecd.org/pisa/test/CPS-Xandar-scoring-guide.pdf.
Pastor, D. A., Barron, K. E., Miller, B. J., & Davis, S. L. (2007). A latent profile analysis of college students’ achievement goal orientation. Contemporary Educational Psychology, 32(1), 8–47. https://doi.org/10.1016/j.cedpsych.2006.10.003.
Popov, V., Biemans, H. J. A., Fortuin, K. P. J., van Vliet, A., Erkens, J. H., Mulder, G., Jaspers, M., J., & Li, Y. (2019). Effects of an interculturally enriched collaboration script on student attitudes, behavior, and learning performance in a CSCL environment. Learning Culture and Social Interaction, 21, 100–123. https://doi.org/10.1016/j.lcsi.2019.02.004.
Pöysä–Tarhonen, J., Häkkinen, P., Tarhonen, P., Näykki, P., & Järvelä, S. (2022). Anything taking shape? Capturing various layers of small group collaborative problem solving in an experiential geometry course in initial teacher education. Instructional Science, 50, 1–34. https://doi.org/10.1007/s11251-021-09562-5.
R Core Team. (2022). R: A language and environment for statistical computing. R Foundation for Statistical Computing. https://www.R-project.org/.
Rohatgi, A., & Scherer, R. (2020). Identifying profiles of students’ school climate perceptions using PISA 2015 data. Large-scale Assessments in Education, 8, 1–25. https://doi.org/10.1186/s40536-020-00083-0.
Rojas, M., Nussbaum, M., Chiuminatto, P., Guerrero, O., Greiff, S., Krieger, F., & Van Der Westhuizen, L. (2021). Assessing collaborative problem-solving skills among elementary school students. Computers & Education, 175, 1–45. https://doi.org/10.1016/j.compedu.2021.104313.
Rosen, Y., & Tager, M. (2013). Computer-based assessment of collaborative problem solving skills: Human-to-agent versus human-to-human approach. Pearson Education.
Rubin, D. B. (1987). Multiple imputation for nonresponse in surveys. John Wiley & Sons, Inc.
Rutkowski, L., Gonzalez, E., Joncas, M., & Von Davier, M. (2010). International large-scale assessment data: Issues in secondary analysis and reporting. Educational Researcher, 39(2), 141–151. https://doi.org/10.3102/0013189X10363170.
Scalise, K., Mustafic, M., & Greiff, S. (2016). Dispositions for collaborative problem solving. In S. Kuger, E. Klieme, N. Jude, & D. Kaplan (Eds.), Assessing contexts of learning: An international perspective (pp. 283–299). Springer. https://doi.org/10.1007/978-3-319-45357-6_11.
Scherer, R. (2020). Analysing PIAAC data with structural equation modelling in Mplus. In D. Maehler & B. Rammstedt (Eds.), Large-scale cognitive assessment: Analyzing PIAAC data (pp. 165–208). Springer. https://doi.org/10.1007/978-3-030-47515-4_8.
Scherer, R., Greiff, S., & Hautamäki, J. (2015). Exploring the relation between Time on Task and ability in Complex Problem solving. Intelligence, 48, 37–50. https://doi.org/10.1016/j.intell.2014.10.003.
Scherer, R., Rohatgi, A., & Hatlevik, O. E. (2017). Students’ profiles of ICT use: Identification, determinants, and relations to achievement in a computer and information literacy test. Computers in Human Behavior, 70, 486–499. https://doi.org/10.1016/j.chb.2017.01.034.
Shaffer, D. W., Collier, W., & Ruis, A. R. (2016). A tutorial on epistemic network analysis: Analyzing the structure of connections in cognitive, social, and interaction data. Journal of Learning Analytics, 3(3), 9–45. https://doi.org/10.18608/jla.2016.33.3.
Siddiq, F., & Scherer, R. (2017). Revealing the processes of students’ interaction with a novel collaborative problem solving task: An in-depth analysis of think-aloud protocols. Computers in Human Behavior, 76, 509–525. https://doi.org/10.1016/j.chb.2017.08.007.
Sinha, P., Calfee, C. S., & Delucchi, K. L. (2021). Practitioner’s guide to latent class analysis: Methodological considerations and common pitfalls. Critical Care Medicine, 49(1), 63–79. https://doi.org/10.1097/CCM.0000000000004710.
Song, J. (2021). Beyond the results: Identifying students’ problem solving processes on a problem solving task [Master’s thesis, University of Oslo]. http://hdl.handle.net/10852/86870.
Spurk, D., Hirschi, A., Wang, M., Valero, D., & Kauffeld, S. (2020). Latent profile analysis: A review and how to guide of its application within vocational behavior research. Journal of Vocational Behavior, 120, 1–21. https://doi.org/10.1016/j.jvb.2020.103445.
Sun, C., Shute, V., Stewart, J., Beck-White, A. E. B., Reinhardt, Q., Zhou, C. R., Duran, G., N., & D’Mello, S. K. (2022). The relationship between collaborative problem solving behaviors and solution outcomes in a game-based learning environment. Computers in Human Behavior, 128, 1–14. https://doi.org/10.1016/j.chb.2021.107120.
Swiecki, A., Ruis, A. R., Farrell, C., & Shaffer, D. W. (2020). Assessing individual contributions to collaborative problem solving: A network analysis approach. Computers in Human Behavior, 104, 1–15. https://doi.org/10.1016/j.chb.2019.01.009.
Tang, P., Liu, H., & Wen, H. (2021). Factors predicting collaborative problem solving: Based on the data from PISA 2015. Frontiers in Psychology, 6, 1–10. https://doi.org/10.3389/feduc.2021.619450.
Teig, N., Scherer, R., & Kjærnsli, M. (2020). Identifying patterns of students’ performance on simulated inquiry tasks using PISA 2015 log-file data. Journal of Research in Science Teaching, 57(9), 1400–1429. https://doi.org/10.1002/tea.21657.
Van den Bossche, P., Gijselaers, W., Segers, M., Woltjer, G., & Kirschner, P. (2011). Team learning: Building shared mental models. Instructional Science, 39, 283–301. https://doi.org/10.1007/s11251-010-9128-3.
Von Davier, A. A., & Halpin, P. F. (2013). Collaborative problem solving and the assessment of cognitive skills: Psychometric considerations. ETS Research Report Series, 2013(2), i–36. https://doi.org/10.1002/j.2333-8504.2013.tb02348.x.
Vermunt, J. K., & Magidson, J. (2002). Latent class cluster analysis. In J. A. Aagenaars, & A. L. McCutcheon (Eds.), Applied latent class analysis (pp. 89–106). Cambridge University Press. https://doi.org/10.1017/CBO9780511499531.004.
Wang, J., & Wang, X. (2019). Structural equation modeling: Applications using Mplus. John Wiley & Sons.
Wilson, A. S. P., & Urick, A. (2022). An intersectional examination of the opportunity gap in science: A critical quantitative approach to latent class analysis. Social Science Research, 102, 1–21. https://doi.org/10.1016/j.ssresearch.2021.102645.
Wise, S., Pastor, D. A., & Kong, X. J. (2009). Correlates of rapid-guessing behavior in low-stakes testing: Implications for test development and measurement practice. Applied Measurement in Education, 22(2), 185–205. https://doi.org/10.1080/08957340902754650.
Wu, Y., Zhao, B., Wei, B., & Li, Y. (2022). Cultural or economic factors? Which matters more for collaborative problem-solving skills: Evidence from 31 countries. Personality and Individual Differences, 190, 1–10. https://doi.org/10.1016/j.paid.2021.111497.
Xu, K. M., Cunha-Harvey, A. R., King, R. B., De Koning, B. B., Paas, F., Baars, M., et al. (2021). A cross-cultural investigation on perseverance, self-regulated learning, motivation, and achievement. Compare: A Journal of Comparative and International Education, 53(3), 361–379. https://doi.org/10.1080/03057925.2021.1922270.
Yamashita, T., Smith, T. J., & Cummins, P. A. (2020). A practical guide for analyzing large-scale assessment data using Mplus: A case demonstration using the program for international assessment of adult competencies data. Journal of Educational and Behavioral Statistics, 46(4), 501–518. https://doi.org/10.3102/1076998620978554.
Yi, H. S., & Lee, Y. (2017). A latent profile analysis and structural equation modeling of the instructional quality of mathematics classrooms based on the PISA 2012 results of Korea and Singapore. Asia Pacific Education Review, 18, 23–39. https://doi.org/10.1007/s12564-016-9455-4.
Zhu, M., Shu, Z., & von Davier, A. A. (2016). Using networks to visualize and analyze process data for educational assessment. Journal of Educational Measurement, 53(2), 190–211. https://doi.org/10.1111/jedm.12107.
Zumbo, B., Maddox, B., & Care, N. M. (2023). Process and product in computer-based assessments: Clearing the ground for a holistic validity framework. European Journal of Psychological Assessment, 39, 252–262. https://doi.org/10.1027/1015-5759/a000748.
Areum Han: Conceptualization, Methodology, Analysis, Writing – Original Draft, Writing – Review and Editing. Florian Krieger: Conceptualization, Writing – Review and Editing, Supervision. Francesca Borgonovi: Conceptualization, Methodology, Writing – Review and Editing. Samuel Greiff: Conceptualization, Writing – Review and Editing, Supervision. All authors read and approved the final manuscript.
Open Access This article is licensed under a Creative Commons Attribution 4.0 International License, which permits use, sharing, adaptation, distribution and reproduction in any medium or format, as long as you give appropriate credit to the original author(s) and the source, provide a link to the Creative Commons licence, and indicate if changes were made. The images or other third party material in this article are included in the article’s Creative Commons licence, unless indicated otherwise in a credit line to the material. If material is not included in the article’s Creative Commons licence and your intended use is not permitted by statutory regulation or exceeds the permitted use, you will need to obtain permission directly from the copyright holder. To view a copy of this licence, visit http://creativecommons.org/licenses/by/4.0/.
Han, A., Krieger, F., Borgonovi, F. et al. Behavioral patterns in collaborative problem solving: a latent profile analysis based on response times and actions in PISA 2015.
Large-scale Assess Educ11, 35 (2023). https://doi.org/10.1186/s40536-023-00185-5